Colorado Conference Series – House Management & Water Meters with Michael Czarick
Didn’t catch part one? Click here.
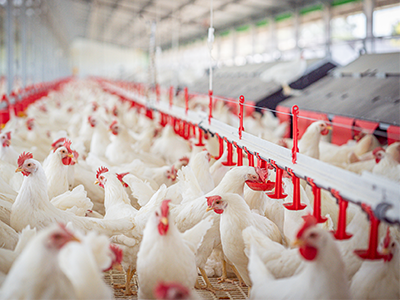
Next in our three-part series is Michael Czarick with the University of Georgia, who gave an informative presentation on proper house management and how it contributes to performance. He stated that one of the best ways for a grower to evaluate how well they are brooding their chicks is by monitoring feed consumption; the greater amount of feed chicks consume, the better they tend to perform.
Knowing how much feed chicks consume on the first day or even first few hours can be very beneficial. But how do we do this? Crop fills can be labor intensive and subjective, while bin scales can be expensive and cannot produce accurate data during brooding. Czarick explained that measuring water consumption is a far better way to determine feed consumption, as the two are very closely related.
Czarick showed a sample graph with daily water usage measurements and flow rates per minute to illustrate his point. He stressed that typical ¾” water meters do not give accurate readings until flow rates reach about .25 gal/min, which in the example he presented, did not occur until the chicks were about a week old.
This is where ultrasonic water meters, such as the Arad Sonata, come into play. The Sonata can accurately measure at 0.05 gallons per minute, has a flow rate display, dual pulse output, is less restrictive to flow, and has no moving parts.
High accuracy ultrasonic water meters can help determine excessive nipple leakage, potential medicator issues, feed issues, lighting issues, and bird density differences. Czarick pointed out though, that daily water consumption graphs only indicate that there IS a problem, not the nature of the problem. He recommends using 15-minute water consumption graphs instead to monitor the peaks and drops.
Dips in 15-minute water consumption graphs can identify issues such as unwanted dark periods, while spikes can indicate a broken nipple. Additionally, comparing water consumption graphs from the front of a house with the rear can help explain density differences. He also showed that changes in light intensity and air movement can be inferred from consumption graphs, and monitoring this can help growers make smoother transitions from side wall inlets to tunnel ventilation.
Czarick emphasized that consumption graphs are the most important feature of any controller, but to have accurate graphs, you need an accurate water meter!
If you would like more information on the University of Georgia’s Department of Poultry Science, please visit www.poultry.caes.uga.edu